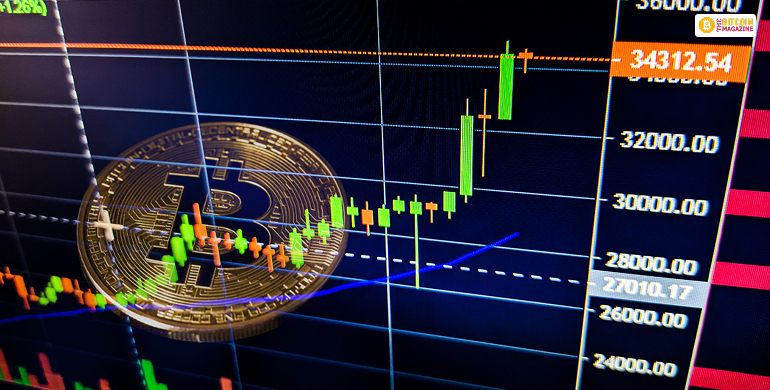
Technical analysis is extensively used in modern trading. This analytical method uses indicators to forecast the status of the future market and analyze movements related to previous prices and volumes of chart data.
Instruments like support levels, chart patterns, moving averages, Bollinger bonds, and others have long been used in stock analysis. Several traders apply the same or similar TA methods to predict future crypto prices.
Due to the principal difference between stocks and crypto, applying the methods and trading directly might be difficult. The process might not be as streamlined as it seems.
Factors dividing Stocks from Crypto.
These factors differentiate stocks from crypto at a broad scale:
Support and Resistance Levels
These are the two primary concepts in technical analysis. The support level refers to the price point at which a downtrend usually halts. However, the resistance level refers to a position where an asset’s uptrend usually fizzles out. The support and resistance levels offer generous insights for equities and crypto markets.
Bollinger Bands
The Bollinger bands are a band trio that analysts plot on the price chart. Here, the central band highlights the asset’s 20-period moving average. The two bands on the sides represent the major standard deviations above and below the moving average.
Volume Profiles
The whales in crypto trade and institutional investors in equities often use volume-based strategies. They use TA tools, including volume-weighted average price and various cluster profile indicators.
VWAP suggests the average price ratio against the net trading volume of all assets. The volume profiles are part of the TA indicators and suggest the trading volume spread across multiple price levels.

